In This Topic
QT-Diagram
QT Diagrams are used to define the behaviour of the heat exchangers. You must do a calculation (simulation or validation), before you can create a QT-diagram.
Attention: a QT-diagram is only suitable for a steady state solution i.e. Q21 ≈ Q34. In general transient case Q21 ≠ Q34 since a part of heat is stored in the heat exchanger walls.
The QT diagrams consider the non-linearity (curvature of the curves) in areas without phase change.
Due to the sometimes strongly varying dependency of the specific heat capacity (CP) on the temperature, the curve progression in the QT diagram cannot be linear. In some cases such a non-linearity can even lead to a pinch point violation, which indicates unphysical assumptions. The curvature of the curves in QT diagrams is considered in the areas without phase change (gaseous, liquid).
Creating a QT-Diagram
QT-Diagrams are displayed through the menu option "Extras --> Diagrams -->q,T-Diagram…".
Here, you have different options for selection. The cursor takes on a special appearance for the selection, it appears with the short form "QT" or "QTX". After the selection is completed, a window appears in which the reference-side (primary or secondary) has to be chosen, and then the diagram is displayed.
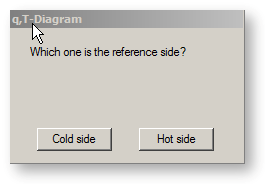
Normally, there are two ways of constructing a QT-diagram. You can either use the underlying medium as reference (this is the heated medium) or you can use the secondary medium (the cooled medium). for instance, for a feed water preheater, the elementary (water) side is the normal reference medium, while for a heat extraction steam generator, the secondary (flue gas) side is the normal reference medium. In most cases, EBSILON®Professional decides about the use of the reference side, but sometimes a dialog appears asking you to make the decision. If you have selected a double heat exchanger, an additional question can also appear, which allows you to decide about the flow to be used.
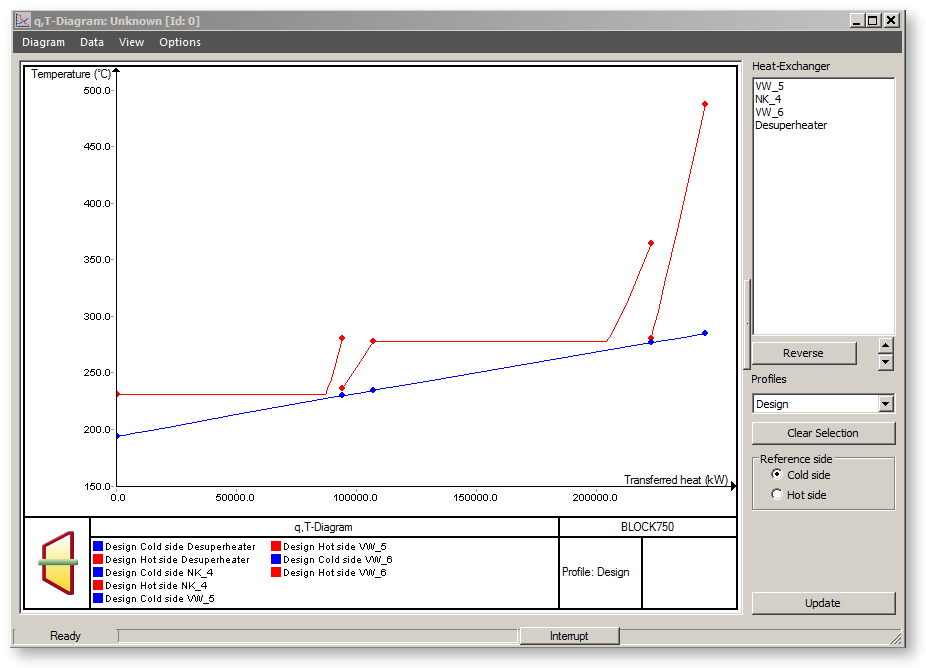
The QT-diagram now appears as follows:
Modifying a QT-Diagram
A list of heat exchangers is present on the right side, which are linked in the diagram. You can select one or more heat exchangers from this list. The corresponding lines in the diagram get converted in inverse colours, in order to show you, where you are. Use the button "Reset Selection" to return to the original colours.
The arrow buttons below the list allow you to rearrange the components in the diagram. In most cases, this can be helpful for the extended selection (e.g. when gaps are included). In addition, it is also possible to change the reference side.
As a matter of principle, the QT diagram is structured in such a way that it provides a useful representation of the heat exchanger in counterflow operation. The heat-absorbing flow (primary flow) is represented in flow direction, Q=0 is the inlet point, and the point with the highest Q-value is the outlet point. The exothermic flow (secondary flow) is represented against the flow direction. The point with the highest Q-value is the inlet point, whereas the outlet point is at Q=0. By means of this representation, the physical conditions in the counterflow heat exchanger are displayed in such a way that it is easy to determine whether a behaviour is physically possible or not. If the lines cross, the behaviour is not possible like this.
Heat exchangers in concurrent flow operation are represented similarly by Ebsilon. Unfortunately, the simple physical interpretation is not possible in this case. It is true that for an individual heat exchanger, the representation might be inverted; however, this would lead to problems when attaching several heat exchangers in a series.
Carnot-QT-Diagram
Alternatively to the q,T layout you can use the Carnot factor instead of temperature on the y-axis via "View à Carnot factor diagram". The
Carnot factor = 1 - T/Tref
with Tref : reference temperature.
The temperatures T (current) and Tref (reference) are the absolute temperatures in Kelvin
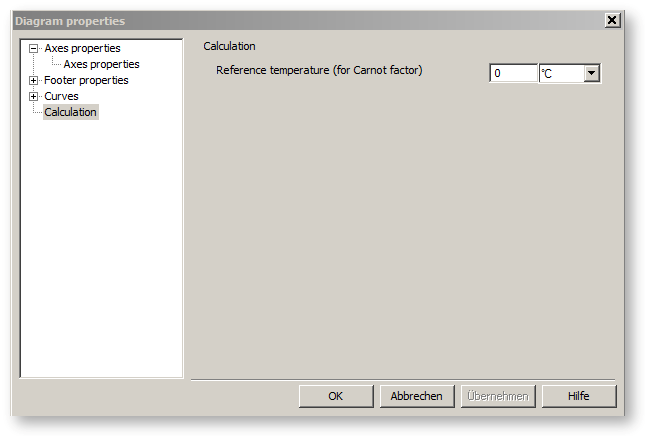
The reference temperature can be set under OptionsàPropertiesàCalculation.
In the QT Carnot factor diagram, it is possible to display the exergy losses (corresponds to the SI unit of kW). These losses are determined as the integral area between the two curves (“cold” and “hot” side) of a heat exchanger.
The display is activated / deactivated via the menu item “View à Show exergy losses” in the diagram dialog. The display can only be activated for the QT Carnot factor diagram type.
Saving a QT-Diagram
The following parameters belong to a diagram configuration and are saved(see also "Data Transfer and Results Display" "Creating Diagrams"):
-
Curve properties: colours, line thicknesses, curve key for all curves at the cold and at the warm side of the heat exchangers corresponding to profile IDs
-
Flag of the reference side (cold / warm)
-
List with names of the objects that are displayed in the diagram
-
List with names of the profiles that are displayed in the diagram
Boiler components in the QT diagram
In the QT diagram Components 88 (Boiler: flue gas zone) and 89 (Boiler: bundle heating surface) can be displayed as well. As these components only contain one side of the heat exchanger in each case, they are always represented in pairs (Component 89 with Component 88 connected via Pin 3).