
EBSILON®Professional Online Documentation


After you have done a calculation, you will be interested to know whether it was successful or not. There are three sources that tell you about the last calculation:
Once a calculation has been completed, Ebsilon displays by default whether the calculation was successful, how long it took and how many errors or warnings there are.
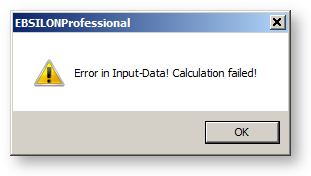
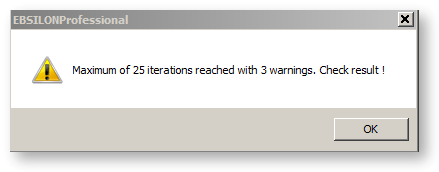
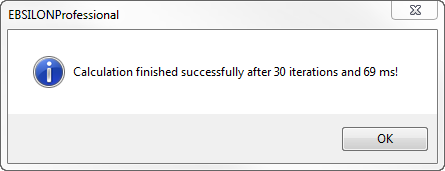
It contains detailed information about the success of your calculation. It is possible that
If the message box has closed, you can also look up this information in the calculation information sheet.
Under “General Options“ à “Calculation“ it is possible to set if this message is to occur
The Error List toolbar opens automatically, if the calculation fails.
You can also open it manually e. g. with the menu command "CalculationàError Analysis". It contains all the messages of the calculation kernel: errors, warnings and comments.
You can open the calculation information sheet from the menu command "ExtrasàModel Options", page "Results". it contains summary information, such as the type and the state of the calculation, number of iteration steps and the run time.
For more information, see "Model Options-Results"
This toolbar can be opened e. g. by the menu command "CalculationàError Analysis". If a calculation ends with at least one message of the class "error", this window pops up automatically.
All errors are displayed in tabular form.
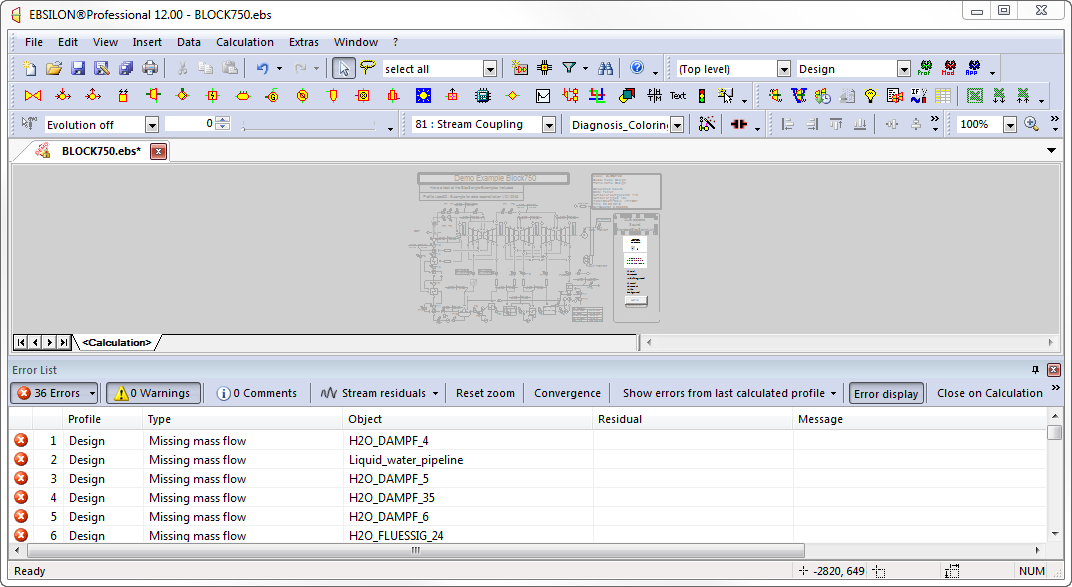
When it is displayed, the colour of the model turns from coloured to gray.
In the top line, the number of
is displayed.
By clicking, the messages of the corresponding category are shown in the table.
For each class, there are certain types.
Errors can be
Warnings can be
Comments are
You can read about the meaning of the error classes in the description of the simulation.
Note that over-determination can be an error as well as a warning:
Intentional over-determinations that arise due to redundant measured values in case of a validation are neither an error nor a warning and will not be reported here.
In the case of over-determination, all components that set the overdetermined variable are highlighted.
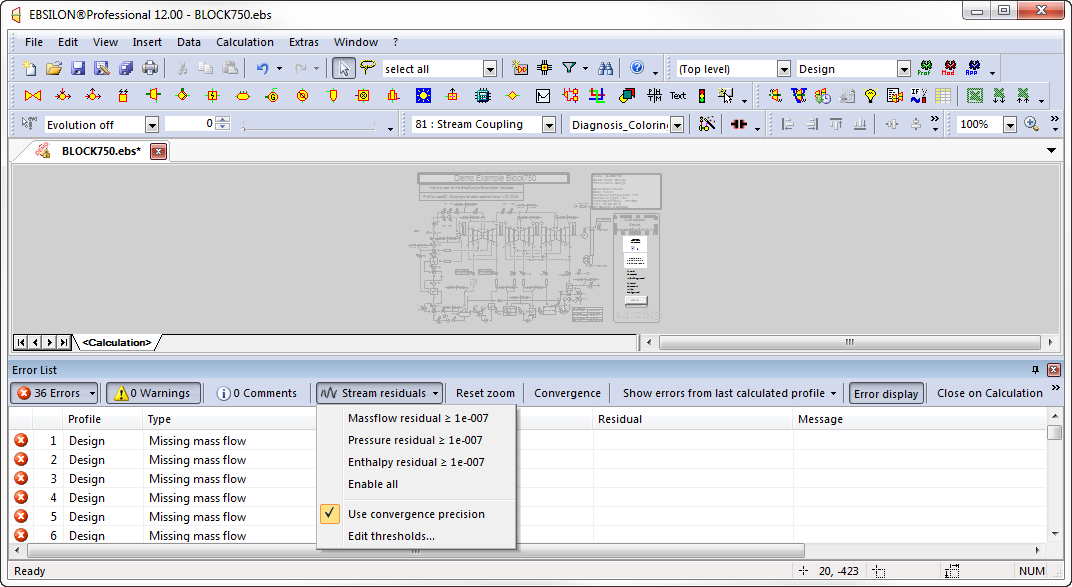
The fourth button “Pipe Residuals“ allows to display lines for which there were changes between the second last and the last iteration step
that transgressed a definable threshold. This button serves as a combo box for selecting whether residuals in the mass flows, in the
pressures, or in the enthalpies are to be displayed, or also if all residuals are to be displayed. The convergence limit set in the model can
be used as a threshold, or the limits for each quantity can be entered by selecting “Edit thresholds”.
Moreover there are buttons in the top line that allow to
When clicking on the column headlines in the following line, the table is sorted according the respective size, first in ascending order, and
when clicking again in descending order.
By selecting one or more lines of the table, the corresponding objects in the model are displayed in colour.
In the error list, equation list, and measured value list you can select the corresponding component in the model.
The right mouse key allows defining which action is to be triggered by double-clicking:
The check of the topology for the connection of logic lines, set point value lines, and actual value lines has been tightened. This may result in error messages in the case of some models that previously calculated without an error message.
The following problem cases are detected:
In most cases, these errors will have been caused by unintentionally snapping a free end of a line with activated snap radius. Users who often work with logic constructions are therefore recommended to deactivate the snap radius (under General Options --> Edit).
During the creation of a model, situations often arise in which the calculation (simulation) displays one or more errors.
The toolbar "Error List" is used to localise the errors.
In most cases, this is sufficient to eliminate the errors. Sometimes, however, a detailed determination is required.
A frequently used strategy is
This task is supported by the following two commands:
A) A stream can be ‘sliced’ if it is selected and its context menu ‘Cut open Stream’ is selected via the right mouse button. The stream is cut into two parts at the position of the cursor. The stream values are copied to both parts.
B) For the
their context menu entry ‘Take over stream results to selected component’ is available for the general value input.
The pressure, enthalpy and mass flow of the stream are copied to the default values of the component.
For component 147, the default values INIM, INIP and INIH are used.
With these tools, it is possible to cut out parts of the model and determine them separately.
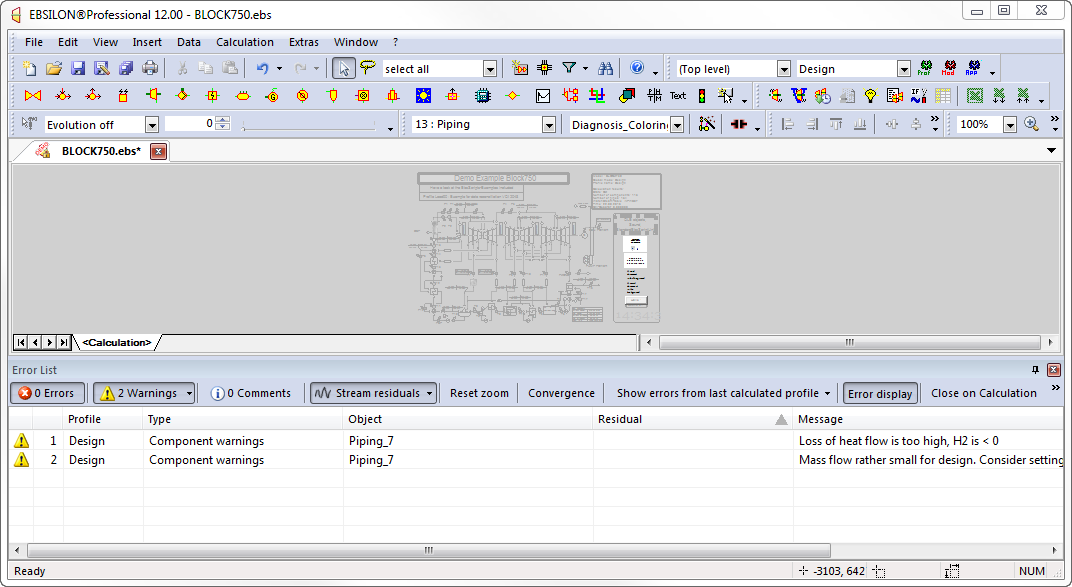
When you click on "OK", warning messages appear for each pipe where the relative deviation for the considered quantity between the two last iteration steps exceeds this limit. For these message, three additional error types are provided:
You can view these messages, like all other messages, by going through the warnings. The message includes the actual value of the deviation for the corresponding quantity.
Note: If you want to figure out the convergence situation of a specific iteration step, set the limit of iteration steps temporary to that number and do a calculation. The calculation will stop at this iteration step, and you can evaluate it.