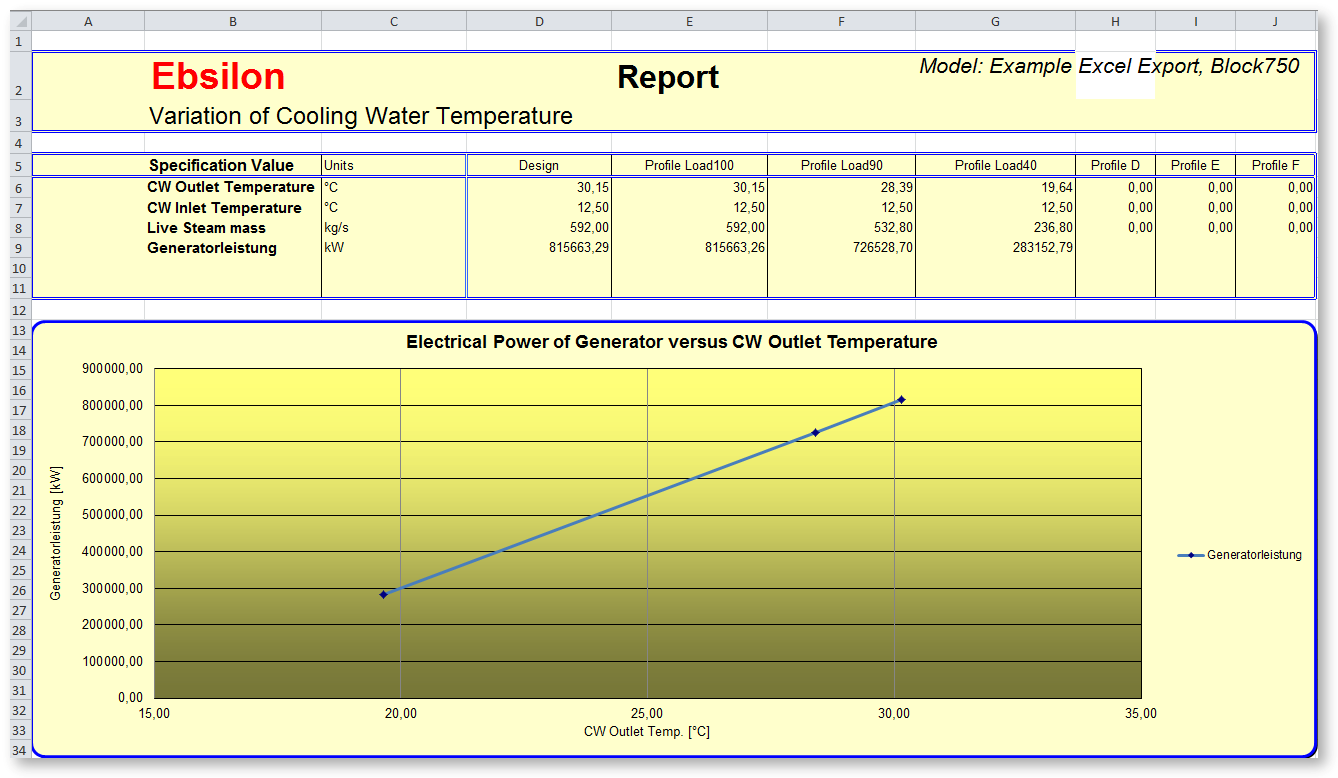

An Excel-sheet of type A provides an overview of the values in the different profiles. A row is used for each specification or result value; the value of this quantity in the respective profile is given in the column. A column serves for determining the unit.
The names of the rows indicates the quantities to be displayed in it. The name must have the following structure:
Example: “S_Electro.Q “ is the name for a row of the Excel-sheet, in which the result value "Q" (power) of the pipe with the name "Elector" is to be entered.
The names of the columns indicate the profile to be displayed in them. The name must have the following structure:
Example: “Bedsonia" is the name of a column of the Excel-sheet, in which the data from the profile "Design" are to be entered.
One column of the Excel sheet must have the name "X_UNIT". A special feature of this column is that even during data export, the entry for the unit is read and the output is then converted in the given unit. In this way, one can define the unit, in which the output is to be done, regardless of the other settings. If you do not specify any unit, then Ebsilon enters the corresponding default unit.
This interface can not only output data from the components and pipes, but also the values of the model variables (global and profile-dependent). However, since Excel does not permit "@" in the name, "_model" and "_prof" are used as key words instead of "@model" and "@prof" respectively. Note that in this way, a double underscore appears in the name.
Example: "S__MODEL.VAR1" is the name for a row of the Excel-sheet, in which the output of the global model variable "Var1" is to be done (in EbsScript syntax "@model.var1").
It is even possible to output the elements of an array. Here, the square brackets are similarly replaced by the underscores.
Example: "S__MODEL.ARRAY1_3_" is the name of a row of the Excel-sheet, in which the third element of the global model array "Array1" is to be printed (in EbsScript syntax "@model.array1[3]").
The image given below shows a section of an Excel report of the type A. The following is printed in the four lines:
The data is printed from six profiles, namely "Variation_A" , "Variation_B" , "Variation_C" , "Eviration" , "Eviration" , "Eviration".

Rows 6 to 9 and columns C to I must be named. The following names were given in accordance with the rules described above:
|
Row/ Column |
Defined name |
|
6 |
S_CoolantInletPipeline.T |
|
7 |
S_CoolantInlet.T |
|
8 |
S_CoolantInletPipeline.P |
|
9 |
S_GeneratorOutlet.Q |
|
C |
X_UNIT |
|
D |
P_Variation_A |
|
E |
P_Variation_B |
|
F |
P_Variation_C |
|
G |
P_Variation_D |
|
H |
P_Variation_E |
|
I |
P_Variation_F |
Excel displays the list of the defined names as follows:
