EBSILON®Professional Online Documentation


The measurement values and the result values obtained from then deviate from their real values through random influences and unknown systematic deviations. To be able to make a statement about these real values, which actually should be the aim of every measurement, it is necessary to specify the confidence intervals.
The uncertainties of results are to be determined as per VDI 2048 Section 4.4 i.e. one must be able to take into account possible stochastic dependencies (covariances).
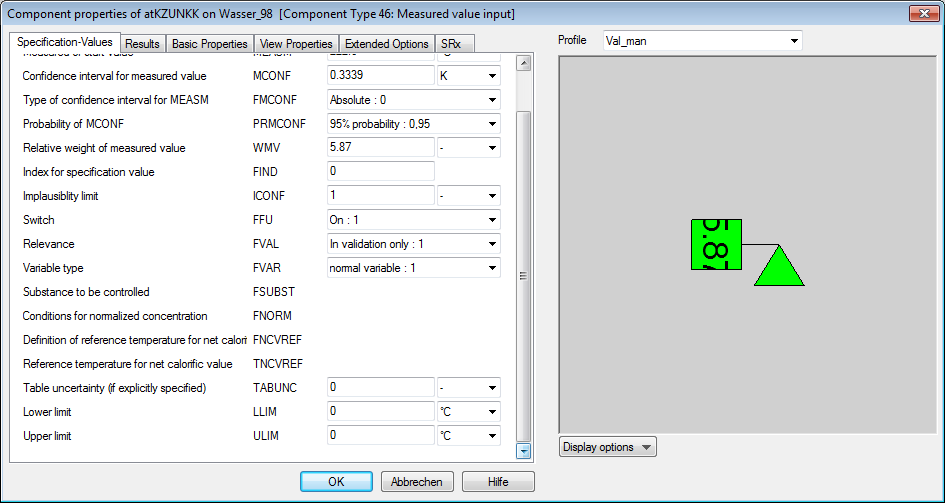
When incorporating a measurement point in the model, EBSILON®Professional demands the specification of the measured value (MEASM) and of the confidence interval of the measured value (MCONF). These values can be entered manually in the specifications screen, can be read via an interface (Excel, SRx-data server) or set with the help of EbsScript.
Covariances among the measured values can be entered in the dialog "Covariance-Matrix" (Menu "Calculate"). In both the first two columns a measurement value can be selected respectively. In the column "Value" the correlations coefficient (between -1 and +1) is to be entered, which is applicable for this pair of measurement values.
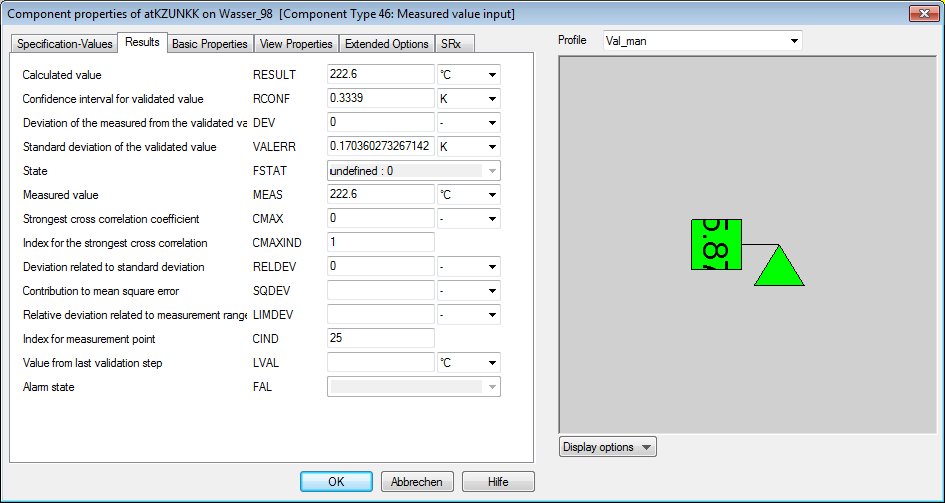
The result (RESULT) and its confidence limit (RCONF) are present on the sheet "Results" of the component properties window after the calculation.
Alternatively, all values can also be displayed in value crosses and text fields:
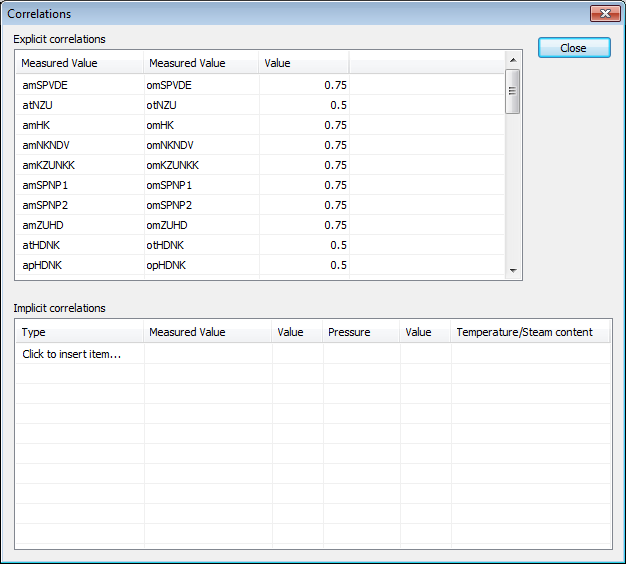
The correlations of the results are shown, when one clicks with the right mouse button on a measurement point and selects the entry "Correlations":
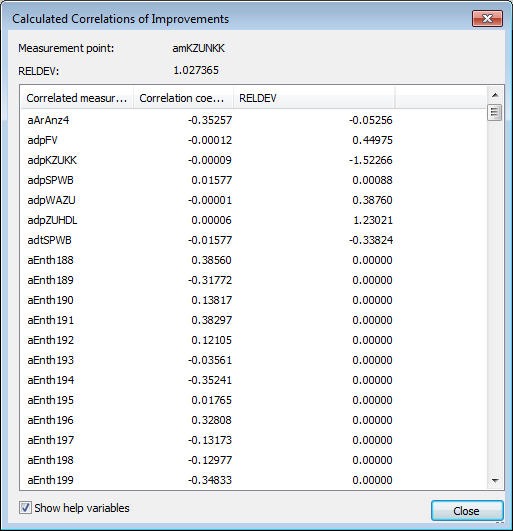
The list can be sorted on the respective parameter by clicking the column heading. In this case the sorting is done on the amount of the correlations coefficient. It is also possible to restrict the list to correlations by applying filters, which exceed a specified amount.
In order to get an overview of all the measurement values of the model, it is possible to display a list of measurement values (Menu "View", "Measurement values list").
In this list too, it is possible to sort the individual columns by double-clicking the column headings. It is also possible to export individual rows (or all) from this table to MS Excel. By a right-click on a row, it is possible to view all the values correlated with the corresponding measurement value.
An Excel-report can be generated with the menu "Data" à "Measurement Data" à "Protocol" à "Validation Results (Excel)":